There are two independent ways to measure the baryon content of the
universe. Both ways measure the ratio ![]() of the present-day number
density of baryons,
of the present-day number
density of baryons, ![]() , to the present-day number density of photons,
, to the present-day number density of photons,
![]() . The results from the two experiments agree to remarkable accuracy.
The agreement is not only between two experimental methods but also
between two epochs in the development of the universe: neutrino
decoupling and recombination.
. The results from the two experiments agree to remarkable accuracy.
The agreement is not only between two experimental methods but also
between two epochs in the development of the universe: neutrino
decoupling and recombination.
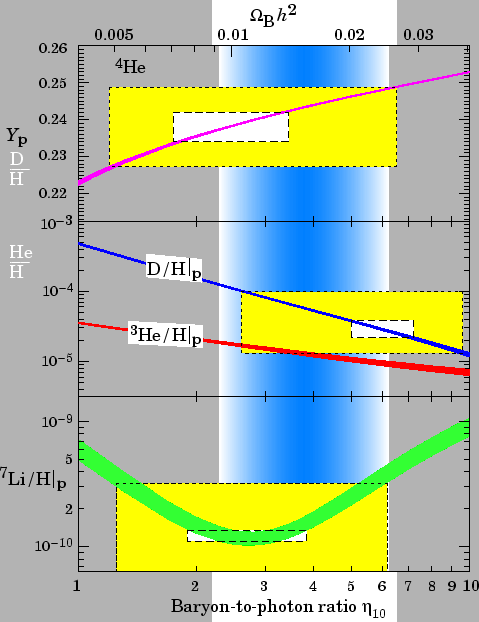
In the big-bang model of the universe, production of light elements
(``big-bang nucleosynthesis'') occurs when the universe has cooled to
the binding energy of the light nuclei,
![]() . The
formation rates of the light elements are sensitive to the nucleon
density, which to good approximation equals the baryon density.
Fig. 1 shows how the primordial abundances of several light
elements vary with
. The
formation rates of the light elements are sensitive to the nucleon
density, which to good approximation equals the baryon density.
Fig. 1 shows how the primordial abundances of several light
elements vary with
![]() [1].
The small boxes indicate
the 1-
[1].
The small boxes indicate
the 1-![]() primordial concentrations extracted from experiment; the
larger boxes indicate the ``concordance'' values. The blue-shaded
background
indicates the ``concordant'' region:
primordial concentrations extracted from experiment; the
larger boxes indicate the ``concordance'' values. The blue-shaded
background
indicates the ``concordant'' region:
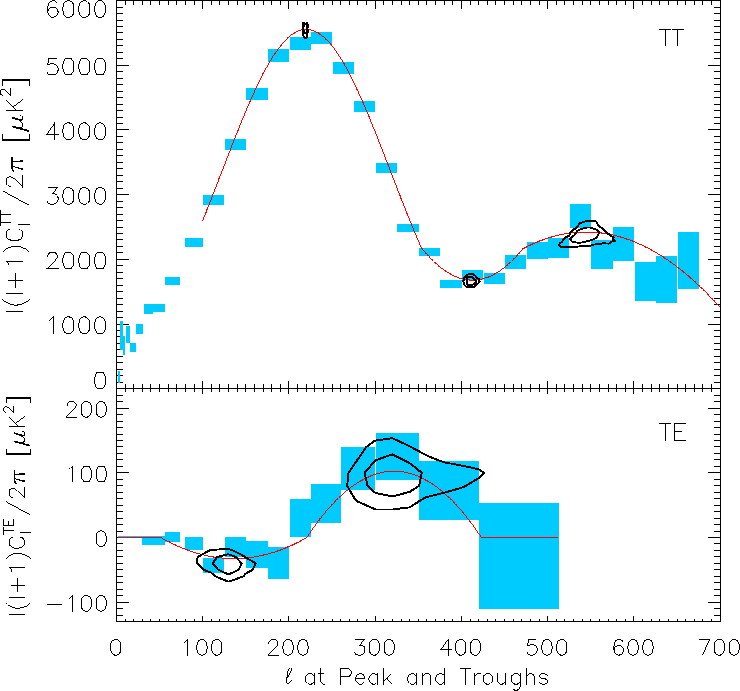
The WMAP CMB anisotropy measurements provide the second experimental
measurement of ![]() . The position of the peaks and troughs as well as
the relative amplitudes are sensitive to many cosmological parameters,
including
. The position of the peaks and troughs as well as
the relative amplitudes are sensitive to many cosmological parameters,
including
![]() . A fit to
the WMAP sky maps extracts the age of the universe, decoupling time,
. A fit to
the WMAP sky maps extracts the age of the universe, decoupling time,
![]() ,
,
![]() and
and
![]() simultaneously
[2]. (For an
interesting discussion of how
simultaneously
[2]. (For an
interesting discussion of how
![]() in particular affects
the power spectrum, see [3].) The combined WMAP and BBN
result yields
in particular affects
the power spectrum, see [3].) The combined WMAP and BBN
result yields
 |
The experimental value of ![]() raises two disturbing questions. ``Why is
the value so small?'' and ``Why is the value so big?'' A variable that
could, as far as we know, choose any value from zero to fifty times the
measured value (when
raises two disturbing questions. ``Why is
the value so small?'' and ``Why is the value so big?'' A variable that
could, as far as we know, choose any value from zero to fifty times the
measured value (when
![]() would be
would be
![]() ) but chooses
to be as small as it is must have a compelling reason to do so. The
smallness of
) but chooses
to be as small as it is must have a compelling reason to do so. The
smallness of ![]() suggests that the ``natural'' value for
suggests that the ``natural'' value for ![]() is
zero, but that through some mechanism it is made to deviate slightly
from this natural value.
is
zero, but that through some mechanism it is made to deviate slightly
from this natural value. ![]() is indeed the most reasonable value
to expect; it is the value that would arise if the universe were
matter-antimatter-symmetric -- every baryon would have an antibaryon
partner, and the net number of baryons would be zero. The great puzzle
is why this number is nonzero, as we will discuss in greater detail in
Sec. 4.
is indeed the most reasonable value
to expect; it is the value that would arise if the universe were
matter-antimatter-symmetric -- every baryon would have an antibaryon
partner, and the net number of baryons would be zero. The great puzzle
is why this number is nonzero, as we will discuss in greater detail in
Sec. 4.