Combined Upper Limit on Standard Model Higgs Boson Production at CDF for Winter 2008
T. Junk5), N. Krumnack2), T. Masubuchi3), J. Nielsen4), W.-M. Yao1)
1)LBNL,2)Baylor,3)Tsukuba,4)UC Santa Cruz,5)FNAL
For Higgs Working Group

Combined Upper Limit on Standard Model Higgs Boson Production at CDF for Winter 2008T. Junk5), N. Krumnack2), T. Masubuchi3), J. Nielsen4), W.-M. Yao1)1)LBNL,2)Baylor,3)Tsukuba,4)UC Santa Cruz,5)FNALFor Higgs Working Group |
|
| WebPage | Public Note | |
| WebPage | Public Note | |
| WebPage | Public Note | |
| WebPage | Public Note | |
| WebPage | Public Note |
 |
|
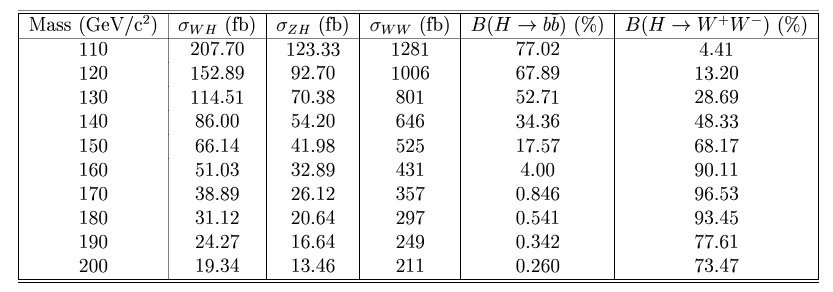 |
| NNLO cross section and branching ratio. Cross Section is refereed from TeV4LHC Higgs working group Branching ratio is refereed from John Conway's Calculation with HDECAY |
 |
 |
| The combined upper limit as a function of Higgs boson mass between 110 and 200 GeV/c2. Solid lines mean observed upper limit for each channel and combined result (black). Dash lines mean expected upper limit for each channel and combined result (black). |
The summary table of observed limit and expected limit between 110 and 200 GeV/c2. |
 |
| Posterior densities for all channels combined for Higgs boson mass between 110 and 200 GeV/c2. Where red arrows indicate the 95% credibility upper limit. |
|
| The distributions of upper limits from pseudo experiments for Higgs boson mass between 110 and 200 GeV/c2. Where red arrows indicate the observed 95% upper limit from data. |
 |
 |
| The combined upper limit as a function of Higgs boson mass between 110 and 200 GeV/c2. Solid lines mean observed upper limit for each channel and combined result (black). Dash lines mean expected upper limit for each channel and combined result (black). |
The summary table of observed limit and expected limit between 110 and 200 GeV/c2. |
 |
| Posterior densities for all channels combined for Higgs boson mass between 110 and 200 GeV/c2. Where red arrows indicate the 95% credibility upper limit. |
|
| The distributions of upper limits from pseudo experiments for Higgs boson mass between 110 and 200 GeV/c2. Where red arrows indicate the observed 95% upper limit from data. |